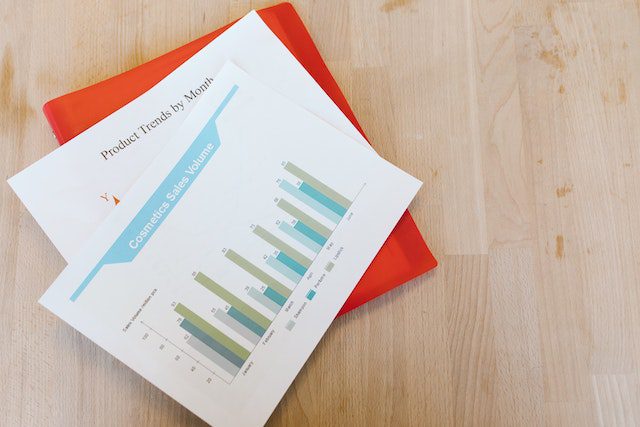
The ability to accurately portray and interpret information has become pivotal for businesses. In fact, businesses rely on various tools and techniques to analyze, and one essential tool is the bar chart. However, many business leaders and professionals lack comprehensive knowledge about this fundamental analytical instrument. Below, we aim to bridge this knowledge gap by providing an in-depth understanding of bar charts.
Understanding the Importance of Bar Charts in Business Analysis

Alt text: Computer screen in an office with lights off showing data in the form of a bar chart
In data analysis, bar charts are invaluable. Whether you are tracking sales performance or evaluating market trends, bar charts make data comparisons incredibly straightforward. They can illustrate and compare large, complex datasets intuitively, translating volumes of data into visual narratives that can be understood at a glance.
Moreover, using a bar chart empowers decision-makers by assisting them in comprehending patterns, discrepancies, and correlations in the data more rapidly than tabular presentations. This not only improves business comprehension and decision-making speed but also initiates discussions based on data.
Despite the apparent simplicity of bar charts, they can efficiently represent multi-dimensional data. Depending on their design, bar charts can concurrently demonstrate multiple parameters without losing their clarity, making them an extremely flexible tool for business analysis.
Fundamental Elements of a Bar Chart
The construction of a bar chart can be broken down into several fundamental parts. The X-axis, or horizontal axis, usually represents the categories into which the data is organized. The Y-axis, or vertical axis, typically depicts the values corresponding to these categories.
The bars themselves extend from the X-axis to the appropriate value on the Y-axis, visually portraying the recorded data. Bars can be drawn vertically or horizontally. The value each bar represents is often shown as a numerical figure on, above, or at the end of the bar.
One critical aspect to remember while interpreting or creating a bar chart is scale. The scale should remain consistent throughout the chart to avoid data misrepresentation. A shift in scale could lead to inaccurate comparisons and conclusions.
In addition to these basic features, bar charts can also incorporate a multitude of other elements, like color or pattern coding, gridlines, labels, and much more, to convey complex information accurately and succinctly.
Effective Utilization of Bar Charts for Business Decision-Making

Alt text: Businessman using tablet with examples of a bar chart on the screen
Bar charts become a useful tool in business decisions when they are accurately used to spotlight trends, patterns, or discrepancies in the dataset. However, an improperly constructed chart can lead to problematic misinterpretations and wrong decision-making.
For instance, bar charts can be used to highlight changes over time, such as revenue growth or decline across various periods. They effectively illustrate comparisons between different categories and can reveal relationships or deviations that might otherwise go unnoticed in a tabular or textual data representation.
In addition, bar charts can illuminate outliers or unusual data points that may indicate problems or opportunities lurking in your business operations. By spotting these potential red flags, organizations can act swiftly and decisively.
As such, a thorough understanding and utilization of bar charts can effectively assist in strategic business decision-making by providing a visual representation of data that is easy to understand and interpret.
Overall, understanding the basic elements and construction methods of bar charts, their importance in business analysis, and the best practices involved in their creation can enhance the data literacy of any organization. They serve as powerful tools for data visualization and decision-making, driving growth and effectiveness in business operations.
Featured Photo by RDNE Stock project: https://www.pexels.com/


